CM 435: Content Analysis of CAHS Social Media Platforms
- Sara Lewter

- Dec 4, 2020
- 5 min read
For my final project, I chose to study the social media accounts of the College of Arts,
Humanities, and Social Sciences (CAHS) at the University of Alabama in Huntsville (UAH). For this study, I observed the CAHS accounts on Instagram, Facebook, YouTube, and Tik Tok to evaluate which media source was more popular and received the most attention, hence which media source is the best one for the CAHS to continually provide content for. For the purpose of my study, I chose to examine the social posts of CAHS from August 2020 through December 4th, 2020.
At the time of my study, CAHS had 702 followers, 392 posts, and was following 371 accounts on Instagram; 328 followers and 312 likes on Facebook; 25 followers, 203 likes, and following 16 people on Tik Tok; 12 subscribers and 775 total views on YouTube. I chose to look at all of the content from this semester (August-December) to give a clear timeframe of posts for my study. The purpose of my study was to determine which social media outlet was more engaging and gained the most attention for the CAHS.
During my analysis I noticed that there were four different types of posts that would appear. These types were as follows: graphics, people, giveaways, buildings. For the purpose of my study, I considered “graphics” to be posts containing information or quotes without a picture. These types of posts often appeared to be a stock photo, clip art, or a wallpaper. These types of posts typically include motivation monday posts, class spotlights, and announcements. The “Building” type posts included photos and/or videos of buildings, classrooms, and labs on
campus where CAHS classes are held. The next category was “people” posts. These types of posts included pictures of students, faculty, staff, or alumni. These posts typically include ambassador spotlights, department spotlights, and achievements of the students, faculty, and alumni. “Giveaway” posts were posts containing giveaways or competitions that had prizes. These posts were typically reminders of giveaways on campus on special days. These posts also contain rules and stipulations of contests held for students and faculty members. Below are examples of posts from each of the four categories.
Here are examples from the “Graphics” category from each social media outlet I examined. The post from Instagram is pictured below on the left. The post from Facebook is pictured below on the right. There were not any posts in this category featured on the CAHS Tik Tok or YouTube account.


Here are examples from the “People” category from each social media outlet I examined. The post from Instagram is pictured below in the upper left corner. The post from Facebook is pictured below in the upper right corner. The post from Tik Tok is pictured below in the lower left corner. The post from YouTube is pictured below in the lower right corner.


Here are examples from the “Giveaways” category from each social media outlet I examined. The post from Instagram is pictured below in the lower right corner. The post from Facebook is pictured below in the upper right corner. The post from Tik Tok is pictured below on the left. There were not any posts in this category featured on the CAHS YouTube account.


Here are examples from the “Buildings” category from each social media outlet I examined. The post from Instagram is pictured below in the upper left corner. The post from Facebook is pictured below in the upper right corner. The post from Tik Tok is pictured below in the lower right corner. The post from YouTube is pictured below in the lower left corner.


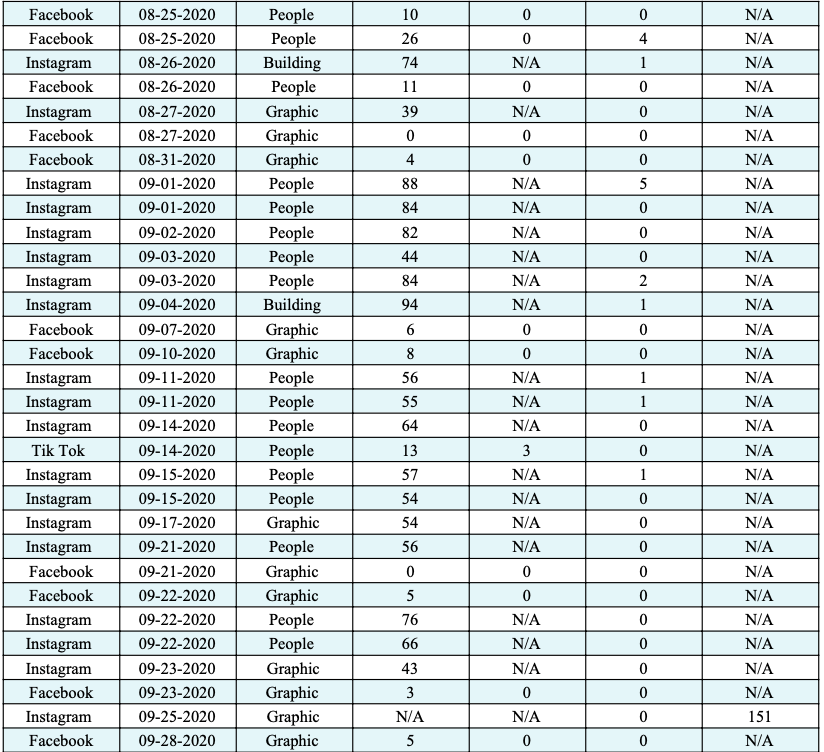
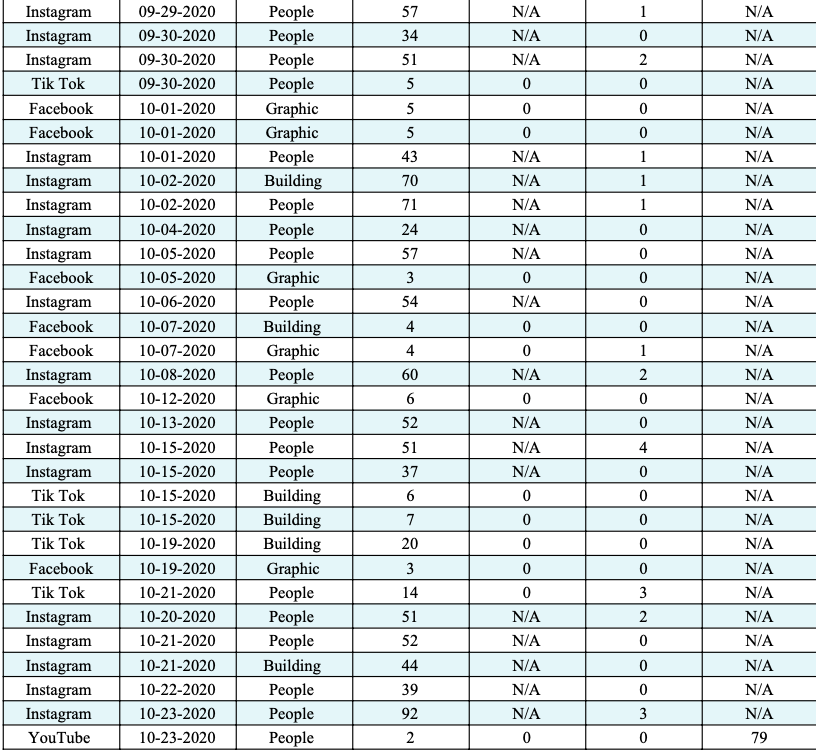
After assigning a category of post to each of the 164 posts I analyzed from this semester, I created a table which included the social media outlet, the type of post, the number of likes, the number of shares, and the number of comments. Below is a full copy of my data table.

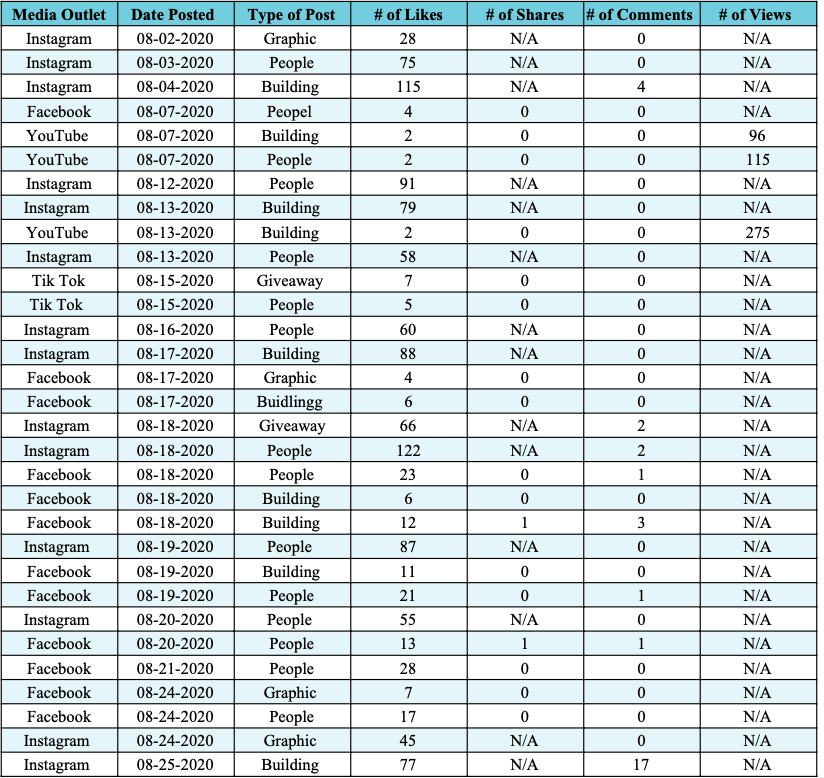


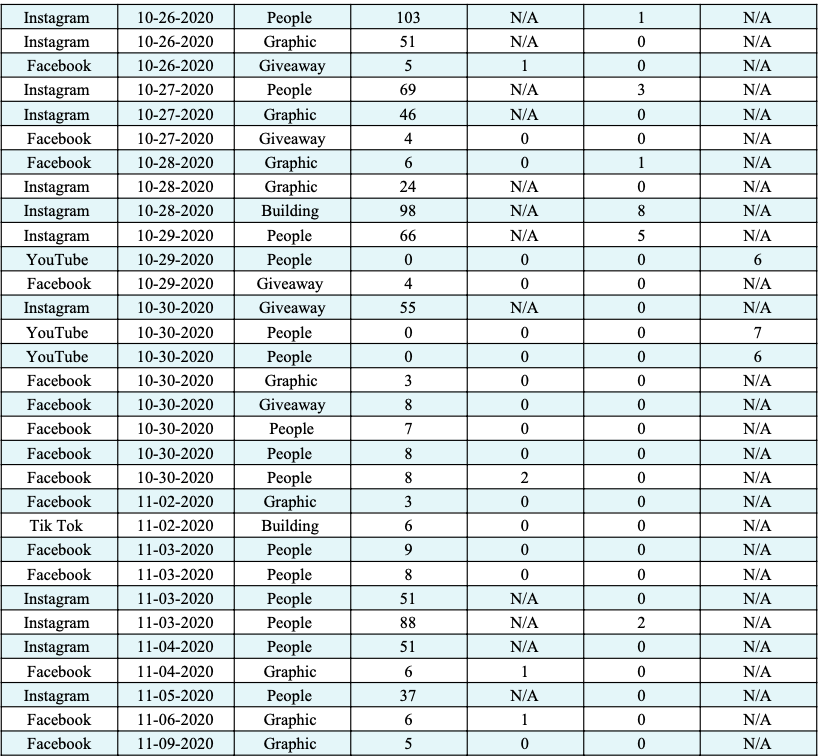

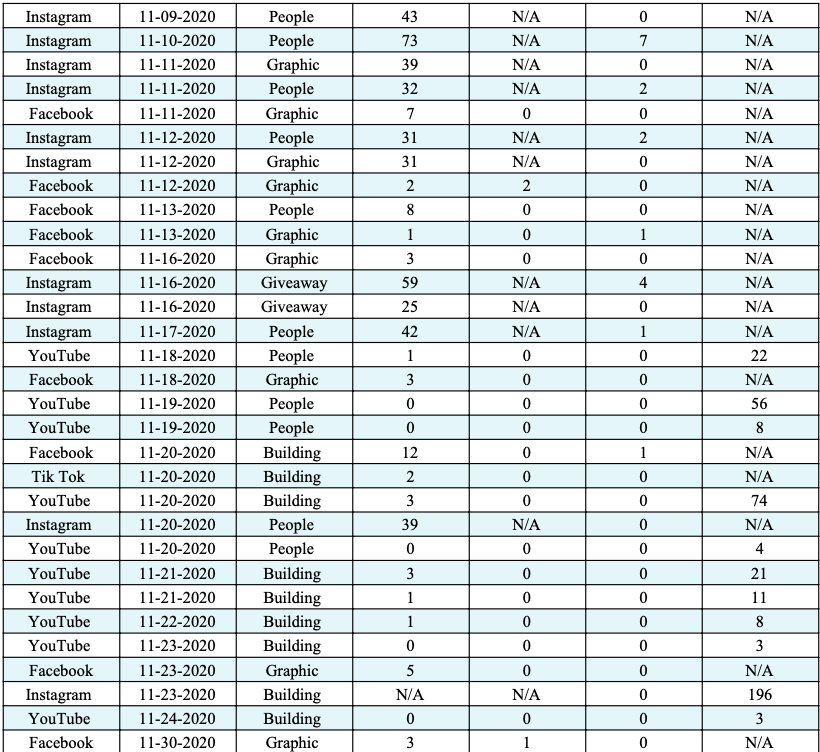
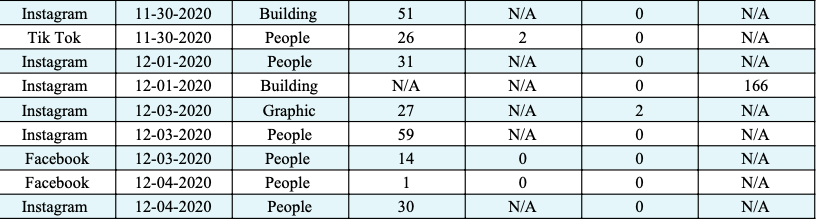
During my content analysis, I found that 25% (41 posts) of the posts were in the “graphic” section, 5% (9 posts) were in the “giveaway” section, 18% (30 posts) were in the “building” section, and 51% (84 posts) were in the “people” section. Out of the 41 graphic posts across the 4 types of social media, 29 posts were from Facebook and 12 posts were from Instagram. Out of the 9 giveaway posts across the 4 types of social media, 4 posts were from Facebook, 1 was from Tik Tok, and 4 were from Instagram. Out of the 30 building posts across the 4 types of social media, 8 were from YouTube, 6 were from Facebook, 5 were from Tik Tok, and 11 were from Instagram. Finally, out of the 84 people posts across the 4 types of social media, 9 were from YouTube, 5 were from Tik Tok, 18 were from Facebook, and 52 were from Instagram.
To further break down the statistics shown in the table, out of the 164 total posts, 79 of them were from Instagram, 11 were from Tik Tok, 62 were from Facebook, and 17 were from YouTube. Also, out of the 4,979 total likes, 409 were from Facebook, 101 were from Tik Tok, 17 were from YouTube, and 4,452 were from Instagram. Out of the 1,307 total views, 794 were from YouTube and 513 were from Instagram. Out of the 214 total comments, 90 were from Instagram, 14 were from Facebook, and 3 were from Tik Tok. Finally, out of the 15 total shares, 10 were from Facebook and 5 were from Tik Tok.
My primary goal with this research project was to study the multiple social media platforms of the CAHS at UAH to gain a better understanding of the different types of content that is posted and which platform is more engaging with the students and faculty of UAH. Throughout my observation of the social media posts made by CAHS from August 2020 through December 4th, 2020, I have come to the conclusion that Instagram is the best media platform for CAHS to utilize. While Facebook and Instagram were quite close throughout the entirety of my observation, Instagram ultimately pulled ahead in almost every category. Also, Tik Tok and YouTube were not much competition as their accounts have not been around for as long and do not have as much content. lThe Instagram account for CAHS posted almost daily (having 79 total(, while Facebook didn't quite post as much (having 62 total). The Instagram account also outnumbered Facebook in likes, having about 4,000 more likes than Facebook posts. The Instagram account also had more comments on their posts than the Facebook account, having about 80 more comments. Furthermore, the content on Instagram consisted mainly of “people” and “building” posts while Facebook was mainly “graphic” posts. I think that if Facebook had more “people” posts it would have been more popular than it was.
Comments